Reduce Freight Emissions With Better Loading: How to Estimate
Better load planning cuts freight emissions by avoiding truck trips. A step-by-step method to estimate the CO2e saving from higher fill rates and report it.
Operations & software · · 5 min read
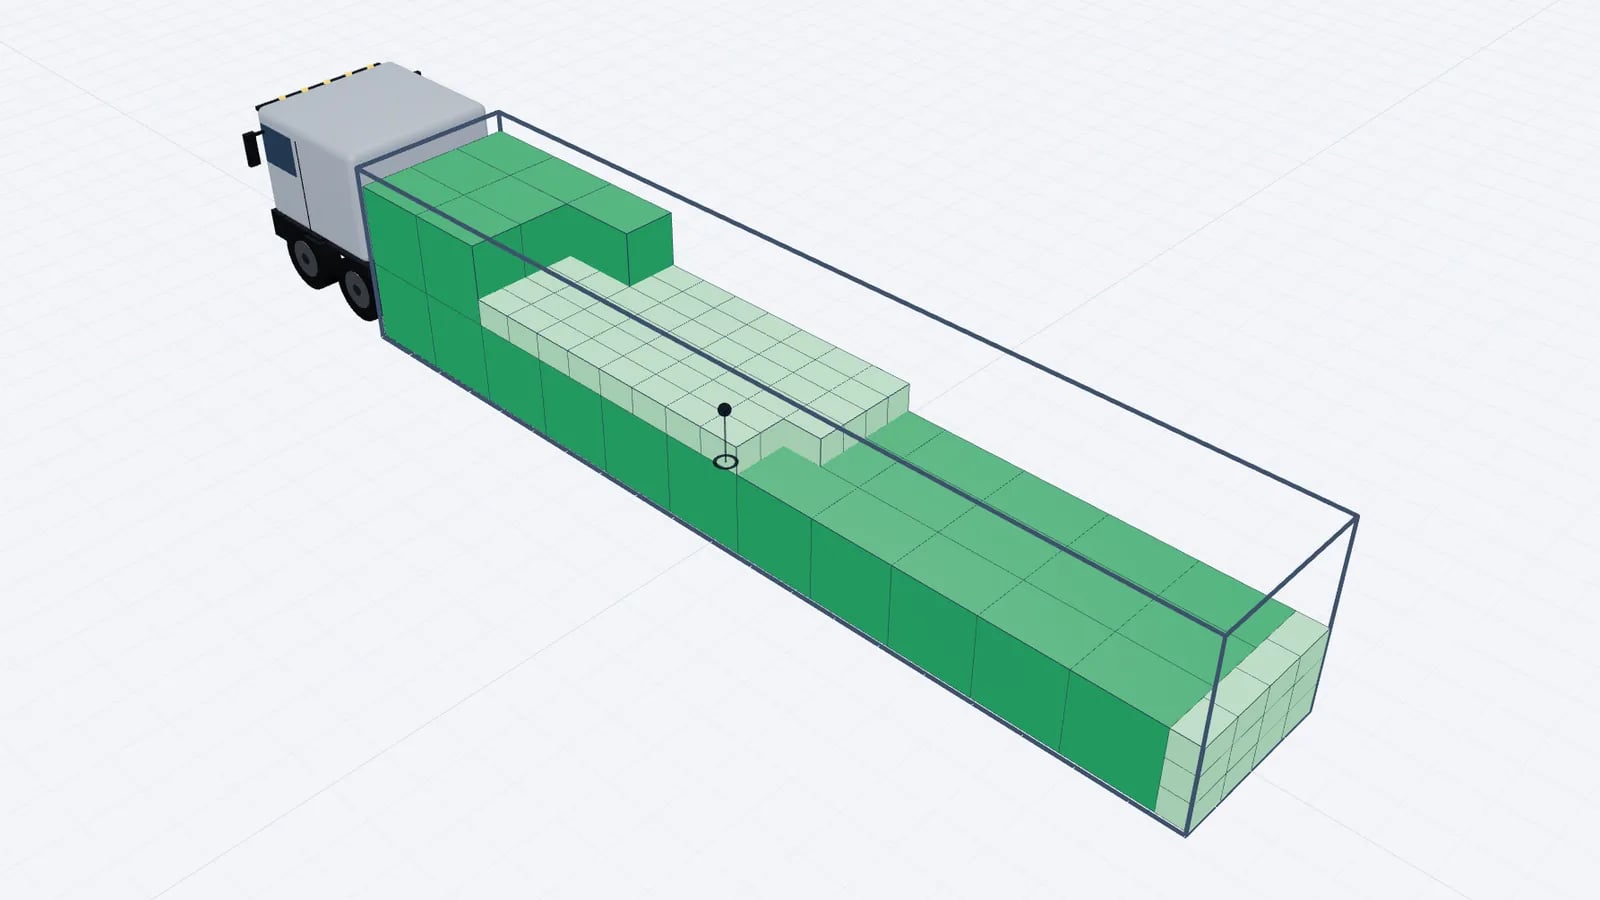
The most direct way load planning reduces freight emissions is by moving the same goods in fewer vehicle trips. Each avoided trip saves the fuel of a whole truck run, while a fuller truck burns only somewhat more than a half-empty one. To estimate the saving, compare the vehicle-kilometres before and after, convert them to fuel or energy, and apply an emission factor from a recognised method such as ISO 14083 or the GLEC Framework.
Why fill rate drives emissions
A large part of a truck’s fuel goes on moving the vehicle itself and overcoming air and rolling resistance, whatever the load. Adding cargo raises consumption, but by much less than running a second truck. So when better planning lets two loads go in one vehicle, or a 34th pallet into a load that would otherwise need a second partial truck, the saving is close to a full trip.
- Fewer trips for the same tonnage or pallet count: the main lever.
- Right-sized vehicles: a well-planned load may fit a smaller vehicle class.
- Fewer failed loads: items left behind at the dock often travel later in a part-empty vehicle.
- Less re-handling on multi-drop routes: shorter stops, less idling, fewer return trips for missed drops.
Planning cannot change the route length or the engine; it changes how many trucks travel and how full they are. See reducing empty space in trucks for the practical levers.
A method to estimate the saving
- 1Pick a flow you can measure: one lane, one customer or one depot, over a fixed period such as a quarter.
- 2Record the baseline: number of trips, average distance per trip, and average pallets, tonnes or LDM per trip.
- 3Record the period after the change on the same basis.
- 4Normalise to the same volume of goods, so growth or a quiet month does not distort the result: trips per 100 pallets or per 100 tonnes.
- 5Convert the difference in trips into vehicle-kilometres avoided.
- 6Convert vehicle-kilometres to fuel using your own fuel records for that vehicle type, preferably split loaded vs empty.
- 7Apply an emission factor per litre (or per kWh for electric trucks) from the source your company reports with, and state whether it is tank-to-wheel or well-to-wheel.
- 8Subtract a correction for the extra fuel the fuller remaining trucks use, if your data allows it.
Good to know
ISO 14083 is the international standard for quantifying greenhouse gas emissions of transport chains, and the GLEC Framework from the Smart Freight Centre is aligned with it. If your company reports emissions formally, use the method and factors it already reports with so your figures are consistent.
A worked example
Say a depot ships about 120 Euro pallets a week on one 500 km lane. Before planning improvements, trucks averaged 24 pallets each, so 120 ÷ 24 = 5 trips a week. After planning mixed loads properly (and double-stacking where the goods allow), the average rises to 30 pallets, so 120 ÷ 30 = 4 trips. One trip a week is avoided: 500 vehicle-km.
Assume, for illustration only, that a loaded articulated truck on this lane uses 30 litres of diesel per 100 km; your own fuel data will differ. 500 km × 30 ÷ 100 = 150 litres per week. Burning diesel releases roughly 2.6–2.7 kg of CO2 per litre (tank-to-wheel); using 2.7 kg, 150 × 2.7 = 405 kg of CO2 per week, or about 20 tonnes over 50 working weeks. Well-to-wheel factors, which include fuel production, are higher.
Now the correction: the four remaining trucks each carry 6 more pallets than before on average, and heavier trucks use more fuel. If your fuel data shows, say, 1 extra litre per 100 km for that added weight, the correction is 4 trucks × 500 km × 1 ÷ 100 = 20 litres a week, about 54 kg of CO2. The net saving is then about 405 − 54 = 351 kg a week. Report the net figure and show the assumptions.
Input: Pallets per week
- Example value
- 120
- Where to get yours
- WMS or shipment records
Input: Pallets per trip, before / after
- Example value
- 24 / 30
- Where to get yours
- Load plans or dock records
Input: Distance per trip
- Example value
- 500 km
- Where to get yours
- TMS, telematics
Input: Fuel per 100 km
- Example value
- 30 l (illustrative)
- Where to get yours
- Fuel cards, telematics, carrier data
Input: CO2 per litre
- Example value
- 2.7 kg (tank-to-wheel, approx.)
- Where to get yours
- Your reporting method’s factor
Input: Extra fuel for heavier loads
- Example value
- 1 l per 100 km (illustrative)
- Where to get yours
- Telematics, loaded vs light runs
| Input | Example value | Where to get yours |
|---|---|---|
| Pallets per week | 120 | WMS or shipment records |
| Pallets per trip, before / after | 24 / 30 | Load plans or dock records |
| Distance per trip | 500 km | TMS, telematics |
| Fuel per 100 km | 30 l (illustrative) | Fuel cards, telematics, carrier data |
| CO2 per litre | 2.7 kg (tank-to-wheel, approx.) | Your reporting method’s factor |
| Extra fuel for heavier loads | 1 l per 100 km (illustrative) | Telematics, loaded vs light runs |
Reporting the saving credibly
- State the method and the factors. Name the standard or framework, the factor source and whether figures are tank-to-wheel or well-to-wheel.
- Normalise. Report trips or emissions per 100 pallets or per tonne-kilometre, not just totals that move with volume.
- Separate planned and actual. A plan that shows 30 pallets per truck only saves emissions if the dock loads it that way.
- Do not double count. If a carrier already reports emissions for your shipments, use their figures for the baseline and the result.
- Keep the evidence. Saved load plans with fill statistics, dock records and fuel data make the claim auditable.
Tip
Fill rate per trip is the leading indicator; emissions follow from it. Track truck fill rate KPIs monthly and calculate emissions quarterly.
Where load planning tools fit in
A planner makes the before-and-after visible for every load: how many pallets were planned, loading metres used, weight against payload, and when a second truck was really needed. In EveryLoading, the stats bar gives those figures per plan, and several trucks are only added when the load genuinely does not fit. Saving the plans gives you a record of fill per trip without extra data entry.
For groupage, consolidating part loads into full ones has the same effect: see FTL vs LTL.
Frequently asked questions
How much CO2 does a fuller truck save?
It depends on distance, vehicle and fuel use. Estimate it from the trips avoided, your own fuel per kilometre and the emission factor your company reports with, minus the extra fuel used by the heavier remaining trucks.
Which standard should I use for freight emissions?
ISO 14083 is the international standard for transport chain emissions, and the GLEC Framework is aligned with it. Use whichever your company or customers already report under.
Does a heavier truck not burn more fuel?
Yes, but much less than an additional truck making the same trip, which is why consolidating loads usually reduces total emissions. Include the extra fuel as a correction in your estimate.
Keep reading
Operations & software · · 5 min read
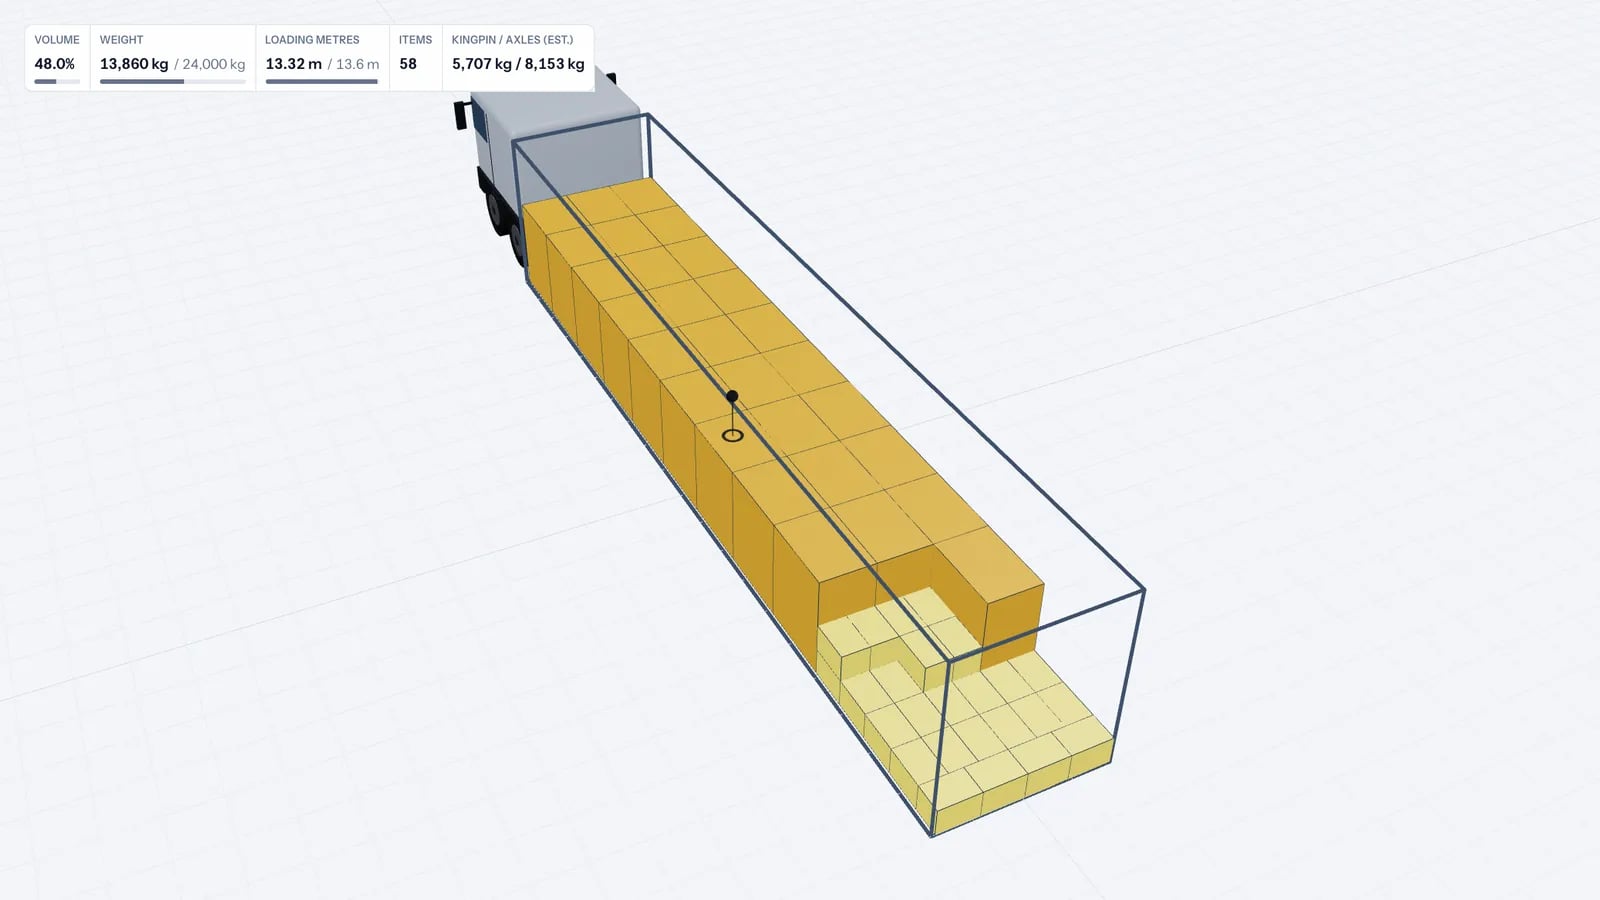
Truck Fill Rate KPI: Formulas, LDM Utilisation, Cost per Pallet
How to measure truck fill rate: loading metre, pallet, weight and volume utilisation plus cost per pallet, with formulas, a worked example and reporting tips.
Read article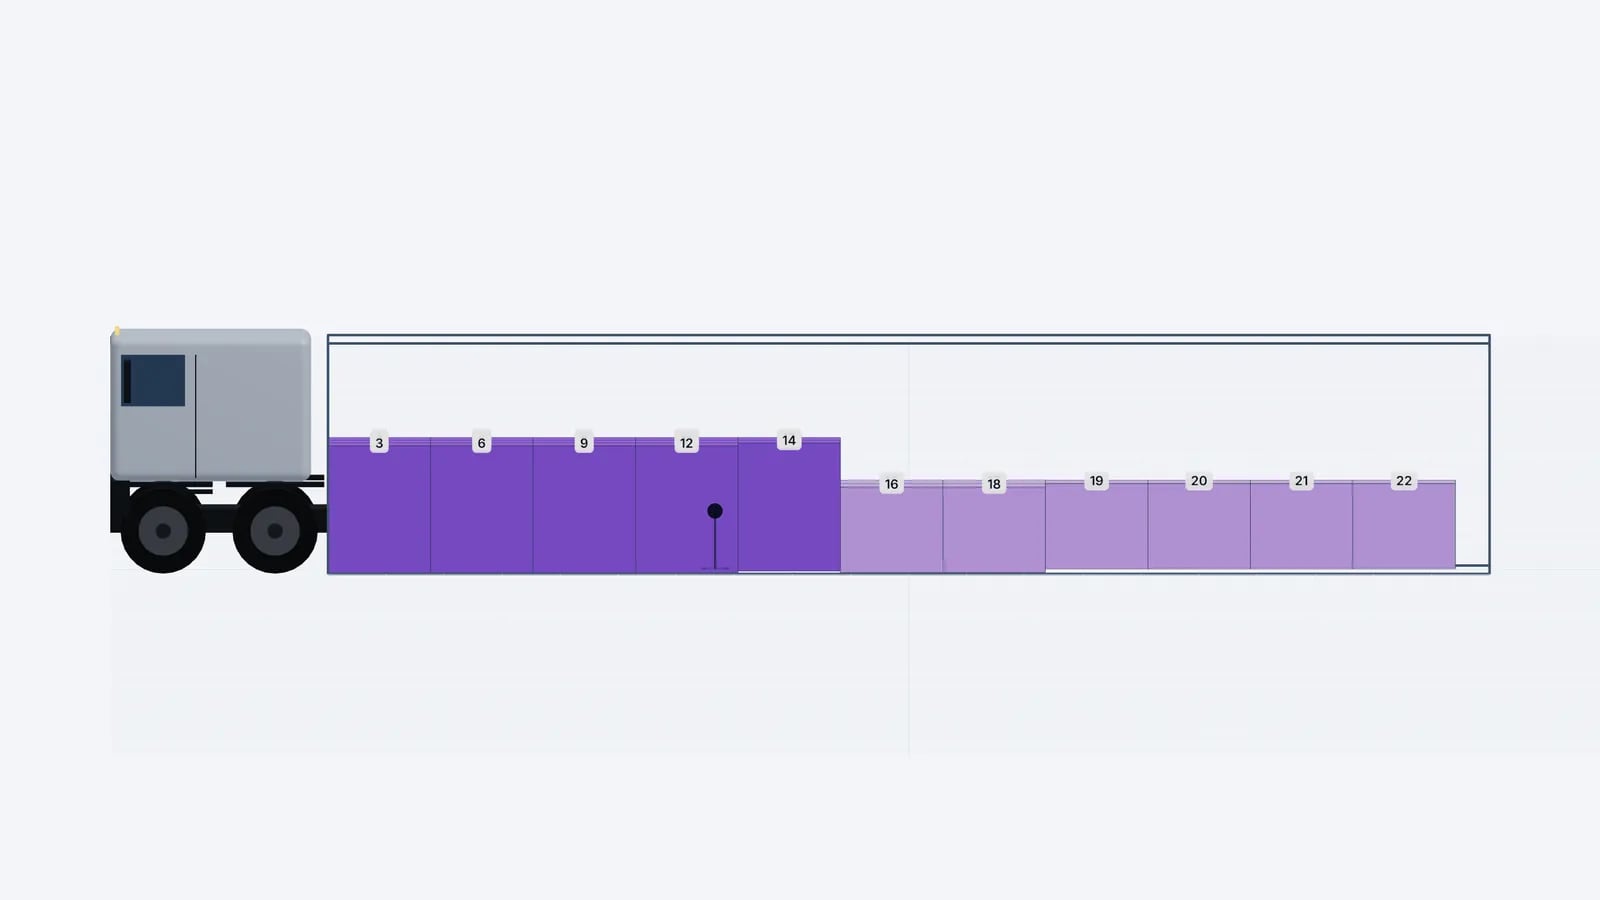
Operations & software · · 5 min read
Loading Plan for Drivers: What the Paper and the Link Need
What drivers and the warehouse need in a loading plan: manifest, loading sequence, top/side/rear drawings, stop order and weights, on paper or a phone link.
Read article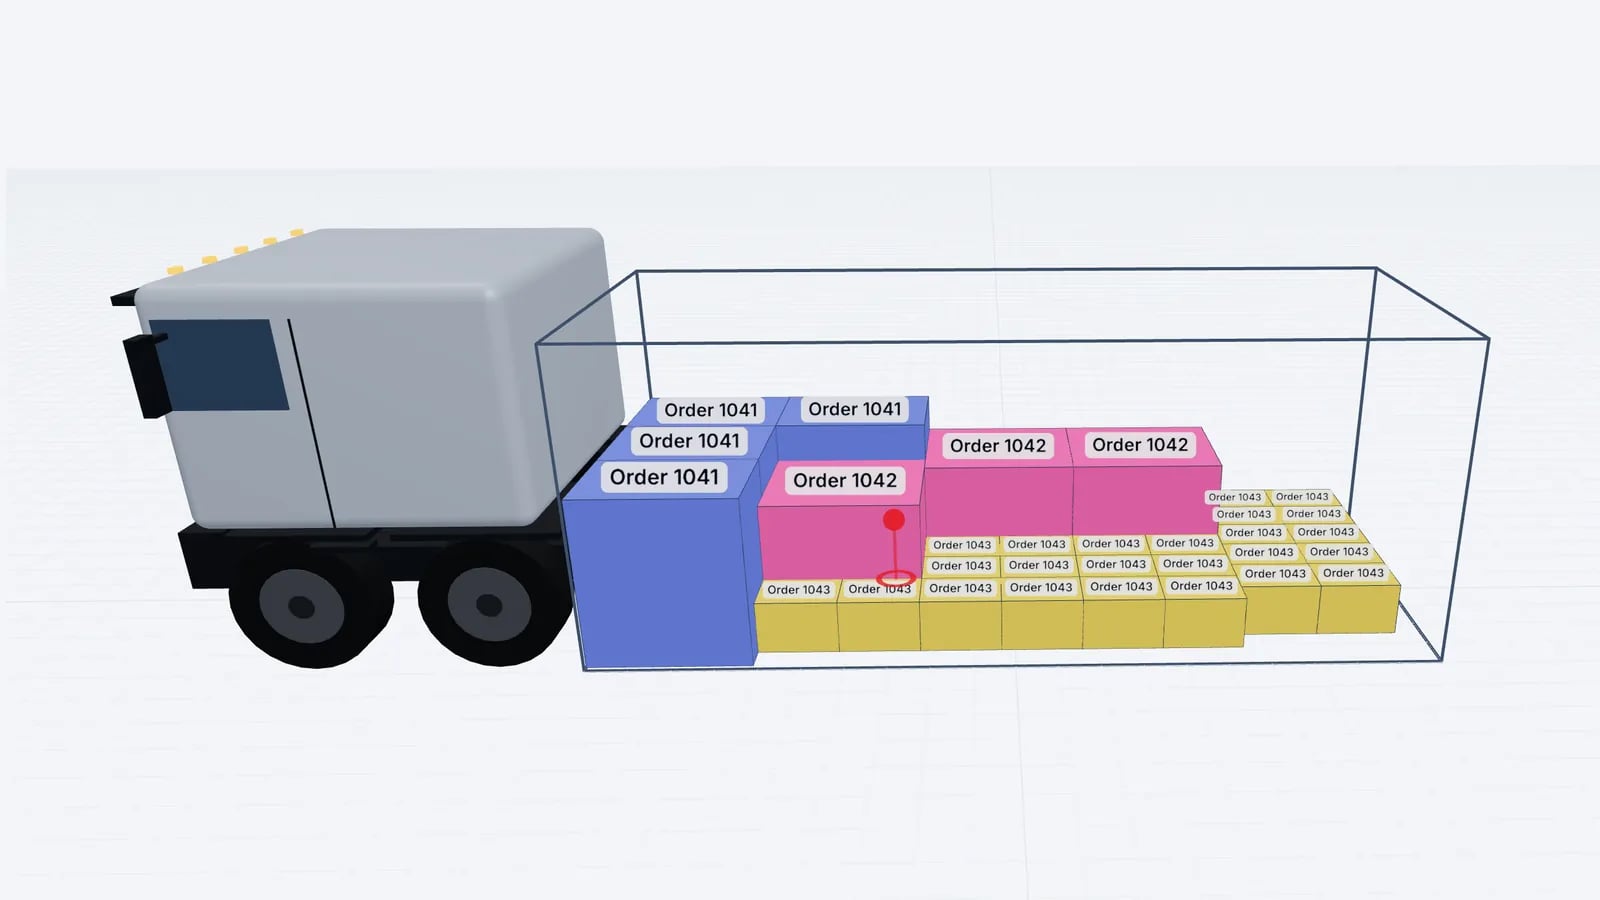
Operations & software · · 5 min read
Load Planning in Excel vs a 3D Planner: When to Switch
Where load planning in Excel works, where it breaks (stacking, mixed sizes, axles, sequence) and how to keep your spreadsheet as input for a 3D planner.
Read article